2. Descriptive Statistics
R has plenty of functions to describe data quantitatively and visually. Before we continue, let’s set the seed since we are sampling.
[1]:
set.seed(37)
2.1. Summarization
2.1.1. Summarization for data structures
The summary function may be used for vectors, factors, matrices and data frames.
[2]:
x <- rnorm(1000, mean=10, sd=2)

print(summary(x))
   Min. 1st Qu.  Median    Mean 3rd Qu.    Max.
  4.277   8.608   9.932   9.963  11.367  17.629
[3]:
x <- factor(sample(c('water', 'soda', 'tea', 'coffee'), 1000, replace=TRUE))

print(summary(x))
coffee   soda    tea  water
   265    263    209    263
[4]:
A <- matrix(rnorm(1000), ncol=2)

print(summary(A))
       V1                 V2
 Min.   :-3.05765   Min.   :-2.675246
 1st Qu.:-0.54951   1st Qu.:-0.635021
 Median : 0.10746   Median : 0.032135
 Mean   : 0.07597   Mean   : 0.004424
 3rd Qu.: 0.71042   3rd Qu.: 0.702054
 Max.   : 3.15093   Max.   : 2.731165
[5]:
df <- data.frame(
    V1 <- rnorm(500),
    V2 <- rnorm(500)
)

print(summary(df))
 V1....rnorm.500.  V2....rnorm.500.
 Min.   :-2.7513   Min.   :-2.80647
 1st Qu.:-0.6653   1st Qu.:-0.64585
 Median : 0.1058   Median : 0.03351
 Mean   : 0.0221   Mean   : 0.09724
 3rd Qu.: 0.6595   3rd Qu.: 0.83527
 Max.   : 3.4937   Max.   : 3.32944
2.1.2. Scalar value summarization
The following functions may be used to produce a scalar value summarization for vectors.
minreturns the smallest numbermaxreturns the largest numberlengthreturns the length of the vector (number of elements)meanreturns the average of the elements in the vectorsdreturns the standard deviation of the elements in the vectorvarreturns the variance of the elements in the vectormadreturns the mean absolute deviation of the elements in the vector
[6]:
library(purrr)

x <- rnorm(1000, mean=10, sd=2)

xMin <- min(x)
xMax <- max(x)
xLen <- length(x)
xSum <- sum(x)
xMean <- mean(x)
xMed <- median(x)
xSd <- sd(x)
xVar <- var(x)
xMad <- mad(x)

v1 <- c('min', 'max', 'length', 'sum', 'mean', 'median', 'standard deviation', 'variance', 'mean absolute deviation')
v2 <- c(xMin, xMax, xLen, xSum, xMean, xMed, xSd, xVar, xMax)

for (item in map2(v1, v2, function(x, y) paste(x, y))) {
    print(item)
}
[1] "min 3.72279465941585"
[1] "max 16.3291609049194"
[1] "length 1000"
[1] "sum 10013.9733547688"
[1] "mean 10.0139733547688"
[1] "median 9.93479341285127"
[1] "standard deviation 2.06130538657392"
[1] "variance 4.24897989671867"
[1] "mean absolute deviation 16.3291609049194"
Some of these functions may also be applied to data frames.
[7]:
df <- data.frame(
    V1 <- rnorm(500),
    V2 <- rnorm(500)
)

xMin <- min(df)
xMax <- max(df)
xLen <- length(df)
xSum <- sum(df)

v1 <- c('min', 'max', 'length', 'sum')
v2 <- c(xMin, xMax, xLen, xSum)

for (item in map2(v1, v2, function(x, y) paste(x, y))) {
    print(item)
}
[1] "min -2.85010220013358"
[1] "max 3.83156099100195"
[1] "length 2"
[1] "sum 56.1376545619577"
2.1.3. Summarization with multiple results
The quantile and fivenum functions will return summary with multiple results.
[8]:
x <- rnorm(100, mean=15, sd=3)

xQuant <- quantile(x)
print(xQuant)
      0%      25%      50%      75%     100%
 6.51585 12.83763 14.39959 16.64436 26.07596
[9]:
xFive <- fivenum(x)
print(xFive)
[1] 6.51585 12.82177 14.39959 16.67352 26.07596
2.1.4. Row and column summarization
There are row and column summarization functions for matrices and data frames.
[10]:
df <- data.frame(
    V1 <- c(1, 2, 3, 4, 5),
    V2 <- c(6, 7, 8, 9, 10)
)

print(rowMeans(df))
print(rowSums(df))
print(colMeans(df))
print(colSums(df))
[1] 3.5 4.5 5.5 6.5 7.5
[1]  7  9 11 13 15
 V1....c.1..2..3..4..5. V2....c.6..7..8..9..10.
                      3                       8
 V1....c.1..2..3..4..5. V2....c.6..7..8..9..10.
                     15                      40
You may also use the apply method to produce summaries. The second parameter is either 1 or 2 for rows or columns, respectively.
[11]:
print(apply(df, 1, sd))
print(apply(df, 2, sd))
[1] 3.535534 3.535534 3.535534 3.535534 3.535534
 V1....c.1..2..3..4..5. V2....c.6..7..8..9..10.
               1.581139                1.581139
2.2. Cummulative
You may apply the following functions to find the cummulative value
cumsumcomputes the cummulative sumcummaxcomputes the cummulative maxcummincomputes the commulative minimumcummaxcomputes the commulative maximum
[12]:
x <- seq(1, 5)

print(cumsum(x))
[1] 1 3 6 10 15
[13]:
x <- seq(1, 5)

print(cummax(x))
[1] 1 2 3 4 5
[14]:
x <- seq(1, 5)

print(cummin(x))
[1] 1 1 1 1 1
[15]:
x <- seq(1, 5)

print(cumprod(x))
[1] 1 2 6 24 120
2.3. Tables
The table command builds a contingency table. When table is used on a vector of numbers, a sort frequency distribution appears.
[16]:
x <- c(5, 4, 4, 3, 3, 3, 2, 2, 2, 2, 1, 1, 1, 1, 1)
y <- table(x)
print(y)
x
1 2 3 4 5
5 4 3 2 1
The table function may also be used on a vector of characters.
[17]:
x <- c('hi', 'hi', 'hi', 'bye', 'bye')
y <- table(x)
print(y)
x
bye  hi
  2   3
Here’s the table command used on a matrix.
[18]:
s <- sample(seq(1:10), 100, replace=TRUE)
m <- matrix(s, ncol=5)
print(m)
      [,1] [,2] [,3] [,4] [,5]
 [1,]    9    6    2    9    2
 [2,]    6    1    7    8    3
 [3,]    3   10    7    4    3
 [4,]   10    1    6   10   10
 [5,]    1   10    3    2    9
 [6,]    6    5    8    2    6
 [7,]   10    7    9    2    8
 [8,]    6   10    7    9    1
 [9,]   10    8   10    1    4
[10,]    9    2    2   10    3
[11,]    9    3    5    7    5
[12,]    6    1    4   10    8
[13,]    5    9    7    2    2
[14,]    3    1    4    5    9
[15,]    5    6    6    2    6
[16,]    9    7   10    6    7
[17,]    7    3    4    2   10
[18,]    9    3    5    4    6
[19,]    8    5    1    1    9
[20,]    9    1    8    7   10
[19]:
y <- table(m)
print(y)
m
 1  2  3  4  5  6  7  8  9 10
10 11  9  6  8 12 10  7 13 14
You may subset a matrix and then apply table.
[20]:
y <- table(m[,1], m[,2], dnn=c('V1', 'V2'))
print(y)
    V2
V1   1 2 3 5 6 7 8 9 10
  1  0 0 0 0 0 0 0 0  1
  3  1 0 0 0 0 0 0 0  1
  5  0 0 0 0 1 0 0 1  0
  6  2 0 0 1 0 0 0 0  1
  7  0 0 1 0 0 0 0 0  0
  8  0 0 0 1 0 0 0 0  0
  9  1 1 2 0 1 1 0 0  0
  10 1 0 0 0 0 1 1 0  0
The following shows using table on a table with numeric and character data.
[21]:
df <- data.frame(
    x <- c(7, 7, 7, 7, 7, 8, 8, 8, 8),
    y <- c('w', 'w', 'w', 'l', 'l', 'l', 'l', 'l', 'w')
)

y <- table(df, dnn=c('x', 'y'))
print(y)
   y
x   l w
  7 2 3
  8 3 1
The following shows using table on a table with numeric data.
[22]:
df <- data.frame(
    x <- c(7, 7, 7, 7, 8, 8, 8, 8),
    y <- c(1, 1, 2, 3, 1, 2, 3, 4)
)

y <- table(df, dnn=c('x', 'y'))
print(y)
   y
x   1 2 3 4
  7 2 1 1 0
  8 1 1 1 1
Use the with command to avoid using dnn with the table function.
[23]:
with(df, table(x, y))
   y
x   0 1 2
  7 0 3 1
  8 1 3 0
2.4. Stem
[24]:
x <- sample(seq(1:10), 100, replace=TRUE)
s <- stem(x)
print(s)
  The decimal point is at the |

   1 | 0000
   2 | 00000000000000
   3 | 0000
   4 | 00000000000
   5 | 000000000000
   6 | 00000000000
   7 | 0000000000000
   8 | 0000000000000
   9 | 000000000
  10 | 000000000

NULL
Compare the stem to the table function.
[25]:
t <- table(x)
print(t)
x
 1  2  3  4  5  6  7  8  9 10
 4 14  4 11 12 11 13 13  9  9
You may control the scaling of the stem function.
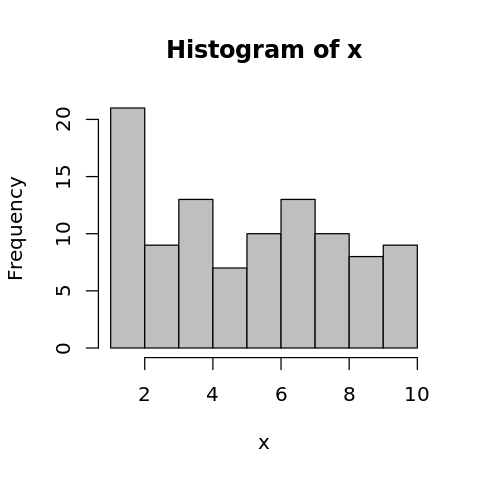
2.5. Histogram
[26]:
x <- sample(seq(1:10), 100, replace=TRUE)

options(repr.plot.width=4, repr.plot.height=4)

hist(x, col='gray75')

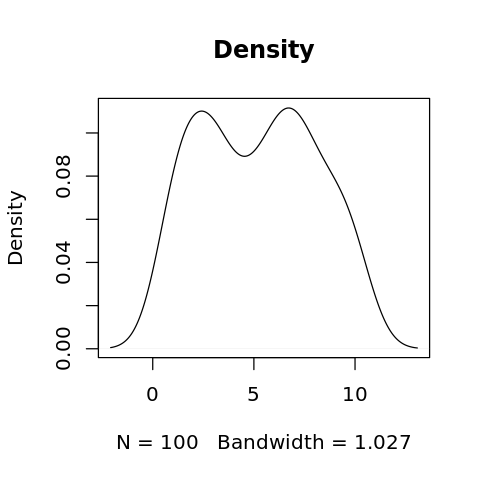
2.6. Density
[27]:
x <- sample(seq(1:10), 100, replace=TRUE)
d <- density(x, bw='nrd0', kernel='gaussian', na.rm=FALSE)
print(d)
Call:
        density.default(x = x, bw = "nrd0", kernel = "gaussian", na.rm = FALSE)

Data: x (100 obs.);     Bandwidth 'bw' = 1.027

       x               y
 Min.   :-2.08   Min.   :0.0003611
 1st Qu.: 1.71   1st Qu.:0.0233831
 Median : 5.50   Median :0.0840966
 Mean   : 5.50   Mean   :0.0658853
 3rd Qu.: 9.29   3rd Qu.:0.1011554
 Max.   :13.08   Max.   :0.1115583
[28]:
options(repr.plot.width=4, repr.plot.height=4)

plot(d, main='Density')

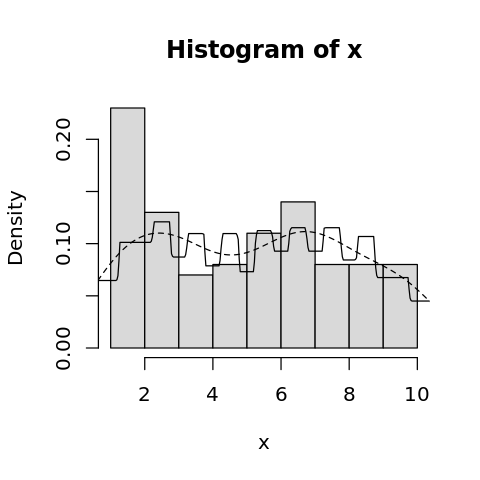
[29]:
options(repr.plot.width=4, repr.plot.height=4)

hist(x, freq=F, col='gray85')
lines(density(x), lty=2)
lines(density(x, k='rectangular'))
